Expected Goals (xG) has become one of the most talked-about metrics in football analysis. Introduced to help quantify the quality of goal-scoring opportunities, xG is a valuable tool for coaches, players, analysts, and fans who seek a deeper understanding of a team’s performance beyond just the final score. This article unpacks the concept of xG, explains its significance, and answers common questions about this game-changing metric.
What is Expected Goals (xG) in Football?
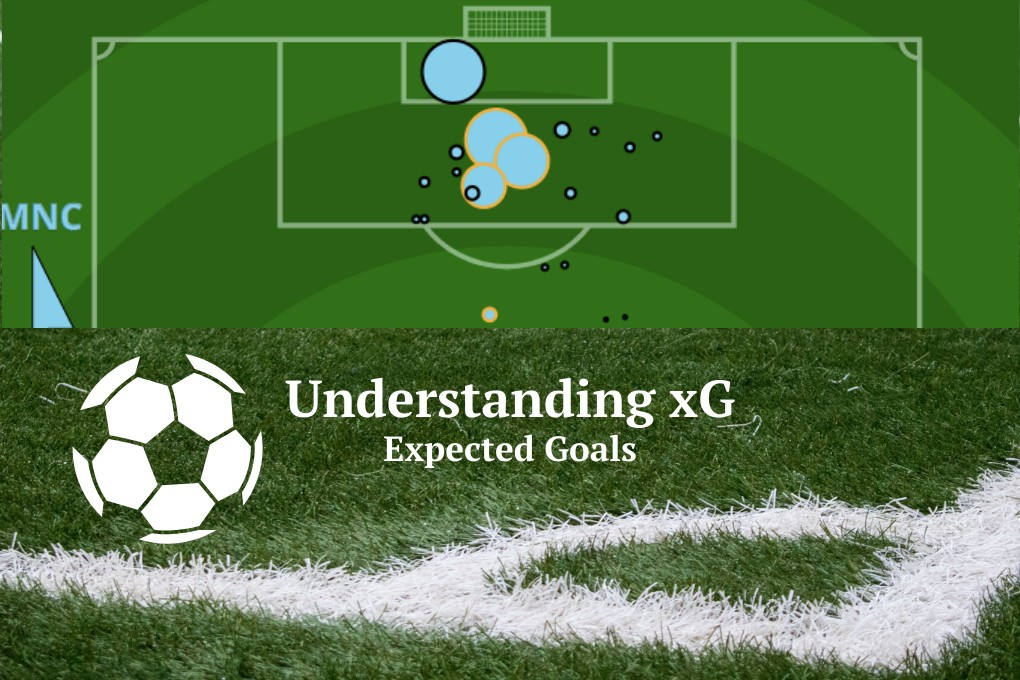
Expected Goals, commonly abbreviated as xG, is a Live Football Streams statistical metric used to measure the probability of a shot resulting in a goal. Unlike traditional statistics that only show the number of goals scored, xG provides insights into the quality and difficulty of the chances created during a match.
An xG score is assigned to each shot based on multiple factors, helping determine how “likely” it was for that shot to end up in the back of the net. In essence, xG measures the chance of a goal in a given situation, with higher values indicating a higher probability of scoring.
Why Was xG Developed?
Football has long been a game with limited quantitative measures for evaluating a team’s true performance. Traditionally, goals scored, assists, possession percentage, and shots on target were the primary stats. While these statistics are helpful, they fail to capture the nuances of match dynamics and chance quality.
The goal of xG is to provide a more accurate assessment of a team’s offensive efficiency and defensive strength by analyzing the likelihood of scoring from specific situations. By examining expected goals, analysts and fans can better understand how well a team performed, regardless of the final score.
How is xG Calculated?
The calculation of xG is complex and considers numerous factors related to each shot attempt. While different data providers may have slight variations in their models, some of the common factors include:
Shot Distance: How far from the goal was the shot taken? Shots closer to the goal generally have a higher xG value.
Angle of the Shot: Shots taken from angles directly in front of the goal are typically more likely to result in goals than those from the sides.
Type of Shot: Headers, volleys, and shots from open play or set pieces each have different probabilities of success.
Type of Assist: Passes that lead to shots—such as through balls, crosses, or cut-backs—affect the xG based on how they set up the shot.
Defender Positioning: The proximity and positioning of defenders can impact the likelihood of scoring.
Match Context: Game situations, such as the scoreline or time remaining, might also influence xG in some models.
These elements are combined into an algorithm to generate a specific xG value for each shot, usually expressed as a decimal. The sum of all xG values for a team or player in a game represents the overall expected goals for that match.
Interpreting xG Scores: What Do They Mean?
The xG metric provides a deeper layer of insight, allowing fans and analysts to see beyond the final score to understand how well a team actually performed. Here are some key ways to interpret xG:
xG in Single Matches: When looking at a single match, a team with a high xG but few goals scored may have had plenty of quality chances but lacked finishing. Conversely, a team with a low xG but several goals scored may have been exceptionally clinical or benefited from mistakes by the opposition.
Cumulative xG for a Season: Over a season, xG can reveal patterns. Teams consistently overperforming their xG may rely on individual brilliance or luck, while those underperforming may need to improve their finishing or chance creation.
Comparing Teams and Players: xG allows for more effective comparisons between teams and players, as it provides context for goals scored. It also helps identify players who consistently create or finish high-quality chances, distinguishing them from those who might score occasionally but with lower efficiency.
Common Misconceptions About xG
While xG is a powerful metric, it is often misunderstood. Here are some common misconceptions:
xG Predicts Goals: xG does not predict the outcome of a match; rather, it provides a probability based on past data. An xG of two for a game does not mean a team will score exactly that number of goals but rather that, given the chances created, scoring that amount is statistically likely.
xG is the Same for All Models: Different data The Women’s Super League 2024 providers may calculate xG slightly differently due to varying algorithms and factors considered. It’s essential to recognize that not all xG values are created equal.
xG Means Goals Will be Scored: High xG does not guarantee goals. A team may generate several high-quality chances but fail to convert due to poor finishing, goalkeeping, or luck.
Why is xG Valuable in Football Analysis?
xG has become integral to modern football analysis because it offers insights that raw goal counts cannot. Here’s why it’s so valuable:
Measuring Efficiency: xG helps quantify a team’s offensive efficiency by showing how well they convert their chances. Teams with high xG conversion rates are typically more clinical, while those with low conversion rates may struggle with finishing.
Assessing Defensive Strength: Just as xG can measure attack quality, it can also indicate defensive strength. Teams Tyson Fury Weight that consistently allow low xG to their opponents are usually defensively sound.
Evaluating Player Performance: xG can distinguish between players who frequently create or finish high-quality chances and those who score from rare opportunities. It’s especially useful for scouting and recruitment.
Understanding Match Outcomes: xG offers a more nuanced perspective on match results. Teams that win despite a low xG might benefit from luck, while those that lose despite a high xG might be unlucky or wasteful with their chances.
How Does xG Help in Predicting Future Performance?
While xG is not a predictive tool in itself, it provides valuable insights into trends. For instance, teams that consistently underperform their xG may eventually improve with better finishing or luck, while those overperforming may experience a drop if their luck runs out.
In player analysis, xG can indicate Leo Borg whether a player is in a “purple patch” of form or consistently delivers quality performances. Scouts often use xG data to assess players’ potential for sustainable success rather than relying solely on goal counts.
To read more, Click Here
Leave a Reply